About this database
ALos Angeles Times analysis of L.A. Unified data published Monday found that quality arts education in the school district is hard to come by. Most schools fail to provide a basic level of instruction, and few are equipped with multiple teachers dedicated to classes like theater, dance or music.
Top schools excelled thanks to help from extra arts instructors, who often train students outside the regular school day, the analysis found. Those schools tended to have students from more affluent families.
The Times analysis was based on a survey of more than 700 L.A. Unified schools. The results for each school have been published here as part of an interactive database. Here's how those records were compiled and analyzed.
What was the source of the data?
Before the 2015-16 school year, administrators at each L.A. Unified campus were asked to fill out multiple-choice questions about how much arts education they provided and yes-or-no questions pertaining to arts funding.
Rory Pullens, the district's head of arts education, said the survey was conducted in order to calculate an "Arts Equity Index" and guide resources to schools most in need.
In addition to questions about arts education, schools were asked to report what percentage of their enrollment was eligible for federal funding aimed at low-income students.
Pullens said this question was included to account for poverty and direct help toward the neediest schools.
He described the survey as the most detailed accounting of arts education ever for a large school district.
Pullens provided The Times with a copy of the index scores and each school's survey results, which formed the basis for this analysis.
Most of those survey responses have been published in profile pages The Times created for each school.
How are The Times rankings different from the district's index?
The Times ranked schools based on their overall score according to L.A. Unified's methodology, where the response to each question was assigned a point value, and then weighted by a multiplier that ranged from one to three.
However, to focus strictly on arts availability, The Times analysis removed the poverty factor from calculations.
A similar indicator of poverty — the percentage of students receiving free and reduced-price lunch — appears on every school's profile page as a reference.
Why are elementary and secondary schools ranked separately?
The questions on the district survey, as well as the scoring of the answers, differed depending on the type of school.
Schools with both elementary and secondary grades were typically asked to complete both surveys.
How were schools assigned a letter grade?
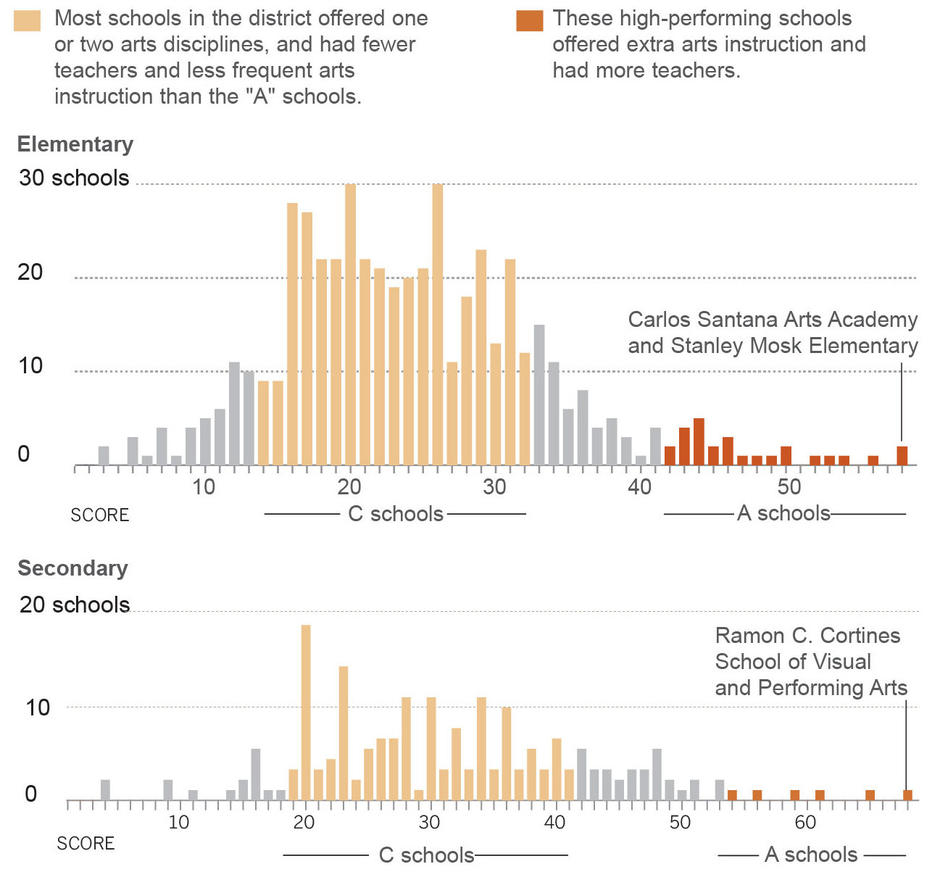
After schools were ranked from highest to lowest, The Times assigned grades based on each school's standard deviation — a statistic that reflects how far a data point is from the center of a group.
- A grades: More than two standard deviations above the median
- B grades: One to two standard deviations above the median
- C grades: Between one standard deviation below and one standard deviation above the median
- D grades: More than one standard deviation below the median
This system is commonly known as grading "on a curve" because it is based on the distribution of scores.
Here are the survey scores for elementary and secondary schools in this data set.

How old are these data?
The survey responses are a snapshot from before the 2015-16 academic year. The current reality for each school may be different. For example, Glenn Hammond Curtiss Middle School in Carson was allocated an arts teacher by the district after administrators indicated on the survey the school offered no arts programs.
Does this database include charter schools?
The district did not survey independent charter schools that operate within L.A. Unified boundaries. However, affiliated charter schools at the district are included in the data.
What about magnets?
Schools that shared an administration, as most magnet programs do, filled out only one survey, according to Rory Pullens, the district's head of arts education.
Do the data have errors?
Yes. Errors in survey responses are known to exist. Rory Pullens, head of arts education at L.A. Unified, said this was likely due to misinterpretation of survey questions. But overall, Pullens vouched for the veracity of the data, saying âit gives us a fairly accurate reality of where our schools are.â
What should I do if I find an error?
If you see an error, please leave a comment at the bottom of the school's profile page and contact The Times.